Library
IBTransaction Monitor User's Guide
Dmitry Kuzmenko, 08-Jun-2008
IBSurgeon Transaction Monitor (IBTM) is a software package designed to monitor, view and analyse dynamic transactions within InterBase and Firebird databases.
IBSurgeon Transaction Monitor User's Guide{C}{C}{C}{C}{C}{C}{C}{C}
What's inside?{C}{C}{C}{C}{C}{C}{C}{C}
Monitor{C}{C}{C}{C}{C}{C}{C}{C}
What is being logged?{C}{C}{C}{C}{C}{C}{C}{C}
Configuration Assistant {C}{C}{C}{C}{C}{C}{C}{C}
Using the Configuration Assistant{C}{C}{C}{C}{C}{C}{C}{C}
Managing the Monitor Service{C}{C}{C}{C}{C}{C}{C}{C}
Configuring Servers{C}{C}{C}{C}{C}{C}{C}{C}
Configuring Databases{C}{C}{C}{C}{C}{C}{C}{C}
Visualizer{C}{C}{C}{C}{C}{C}{C}{C}
What's inside?
IBTM package contains three main modules:
- Monitor – A small Win32 service-based program to monitor and log transaction states from one or more databases.
- Configuration Assistant For configuring settings for the Monitor and Viewer.
- Visualizer Designed to view and analyse the information that is logged by the Monitor.
Monitor
The Monitor is a small Win32 service-based program (ibtm.exe), which works on Windows NT, 2000, XP and Windows Server 2003 and 2008 (both 32 and 64 bit). On start-up the Monitor reads the settings (set by the Configuration Assistant) and monitors the specified database. During monitoring it connects to the database each minute (recommended default interval) and reads the state of transactions.
If InterBase or Firebird is running on Windows, the Monitor can be installed on the server where the database resides. For Linux-based servers, it can be installed on any Windows computer with network access to the InterBase or Firebird server. You can install the Monitor using the following methods:
- Using the Configuration Assistant
- From a command shell window
Important! Before starting to install the Monitor you need to make sure that you are logged on to Windows with Administrator rights and privileges. The Monitor will be installed as a service with Automatic start under the Localsystem user account.
Since the Monitor only periodically connects to the database and writes the information gathered to a plain text log file, there is no need to apply any further rules. However, if you want to secure the Monitor configuration and database login information, you must change the Monitor's service settings and its directory (and log) access as required, via the Windows Service Control Panel.
Monitor configuration parameters will be discussed in the Configuration Assistant.
What is being logged?
The Monitor periodically checks the database header page, and then stores the database transaction information into the log, as follows:
- Log time
- Oldest transaction number
- Oldest snapshot transaction number
- Oldest Active transaction number
- Next transaction number
- Active transactions count (depends on server version)
This information is stored in the log file, and can then be viewed and analysed using Visualizer. Using the visual transaction state information you can understand how long your applications keep transactions open, how many simultaneous transactions are running, how long snapshot transactions are running, when is the most intensive time that applications are starting transactions, etc.
Note: The Monitor logs the transaction state information to the local log file. It does not send this or any other information across the network.
Configuration Assistant
Configuration Assistant (ibtmconfig.exe) is used to set up the configuration parameters for the Monitor and Viewer. It saves the configuration parameters in the ibtm.ini file.
! On Windows Vista or Windows 7 you need to run Configuration Assistant with administrative privileges (right mouse click), or it will be unable to manage IBTM service (Error 5, access denied).
Tip! IBTM does not use the Registry to store configuration parameters, so you can prepare a configuration at one computer, and then move ibtm.ini to another computer where Monitor is installed (The Monitor service needs to be restarted to read new a configuration).
The Monitor and Configuration Assistant are placed by the IBTM installer in the same directory, so that the Monitor and Configuration Assistant share the same configuration file (ibtm.ini).
Using the Configuration Assistant
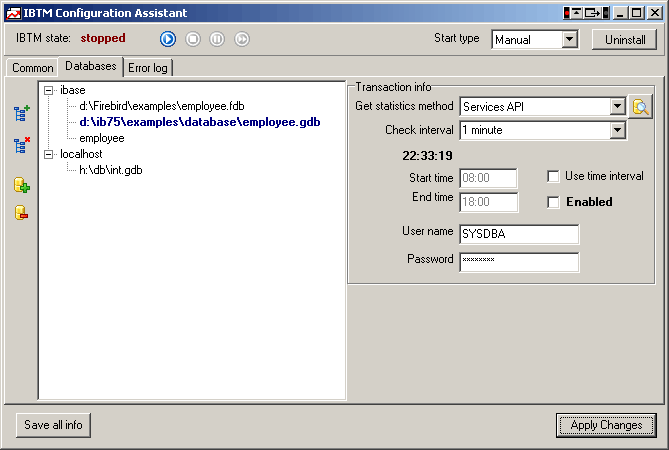
The Configuration Assistant helps you to
- Manage the Monitor service – install, uninstall, start, stop, pause and restart.
- Specify the InterBase or Firebird servers that have databases that need to be monitored
- Specify databases and monitoring/scheduling options for a particular database
Managing the Monitor Service
![]()
When the Configuration Assistant starts, it determines the Monitor service state on the System.
Installing Monitor - if the Monitor service is not installed, you will see a "not installed" message in the IBTM state label in the left upper corner. To install Monitor press the Install button at the right hand side of the window. Note that the Monitor service will use the Start type (automatic or manual) checkbox value. If installing the Monitor service has succeeded, you will see the IBTM state change to "stopped" and the "Run service" button will be enabled.
You need to restart the Monitor service whenever you change any database configuration parameters.
Configuring Servers
IBTM uses the TCP/IP connection protocol to access the database(s) for monitoring. So, if you installed Monitor on the same computer on which the server is, you need to add the server as localhost or the server's host name. Once this is done, you will be able to add the databases that will be monitored on this server.
Configuring Databases
With this version of IBTM you can monitor only a single database at a time. Additional licenses are required for monitoring one or more databases simultaneously. Please contact us for details (www.ibphoenix.com).
However, you can set up several servers and databases and switch between them to select the database to monitor (the active database will be highlighted in bold). With additional licenses you will able to monitor several databases simultaneously.
Use the Add Server and Add Database buttons at the left hand side of the Databases list.
Each database record can be configured with the following parameters:
Get statistics method. This depends on the server version, and supports different capabilities. Each method is being described with its pros and cons:
|
|
Services API |
Firebird API |
TMP$ tables |
|
InterBase 4.x/5.x |
No |
No |
No |
|
InterBase 6.0 Classic |
No |
No |
No |
|
Firebird Classic - |
No |
Yes |
No |
|
InterBase 6.x SuperServer |
Yes |
No |
No |
|
InterBase 7.x/2007 |
Yes |
No |
Yes |
|
Firebird Classic and SuperServer: 1.5.3, 1.5.4 /2.0 |
Yes |
Yes |
No |
Differences between Services API, Firebird API, and TMP$ tables:
|
|
Pro |
Flaws |
|
Services API |
|
|
|
Firebird API |
Allow the facility to get active transactions count information (not more than 4676 active transactions) |
|
|
TMP$ tables |
|
|
If you have chosen a statistics method that is incompatible with your server, nothing will be written in Monitor's transaction log. Check the Error log tab in Configuration Assistant to see errors that may occur whilst monitoring the database.
Check Interval. This determines how often the Monitor takes the transaction information from a database. 1 minute is the minimum interval. You can set 1, 3, 5, 10, 20, 30 minutes, or even a 1 hour interval, but the most informative interval is 1 or 3 minutes.
Using the 1-minute interval, the Monitor will check the database transaction state 1440 times every 24 hours. The size of the log file will be ~150 Kilobytes.
Start time and End Time. If this is not set, the Monitor will take statistics from the specified database the whole time it is working. If the time limit is set, the Monitor will operate for only specified period of time.
User name and Password. The User name and password for the account that will be used to monitor the database transaction state. You can use the SYSDBA login or any other user login you want. If a non-SYSDBA login is used, for Services API and Firebird API methods it is not necessary to grant any additional privileges for that user account. You can create a user like 'TM', and the Monitor will work successfully.
For Temporary System Tables (IB V7.1, V7.5, V2007) the user login must have read access rights on theTMP$TRANSACTIONS and TMP$DATABASES tables. If you use Embedded User Authentification in your InterBase V7.5/V2007 database, you need to create a login and grant those access rights for that database explicitly.
Test Server Connection button.

Allows checking of the specified server for the best method of transaction monitoring. You can also use this button to check whether the selected method works for the specified server.
Visualizer
The Visualizer can view transaction information gathered by the Monitor. The base directory for the .tmd files is taken from the Configuration Assistant settings.
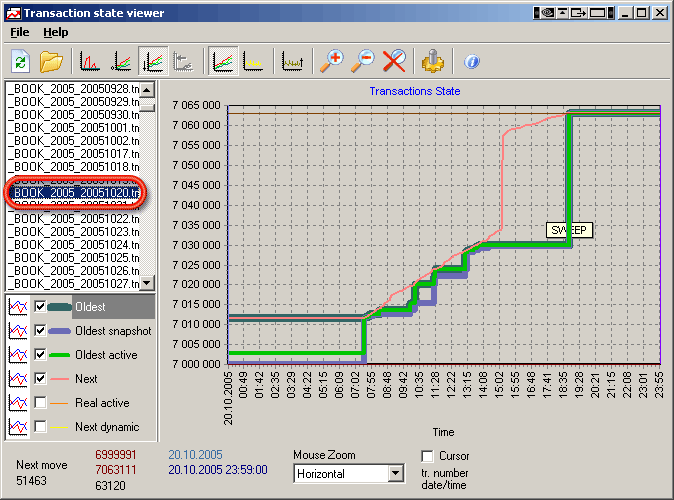
At the left side you can see the list of statistics files. By default the Viewer looks at the Log folder that is in the base installation folder. You can change this folder using the Configuration Assistant, or open the required folder via theViewer menu option.
Click on the statistics file - it will be displayed in the graph immediately. You can check multiple statistics at the same time by pressing Ctrl or Shift button and clicking on the statistics files:

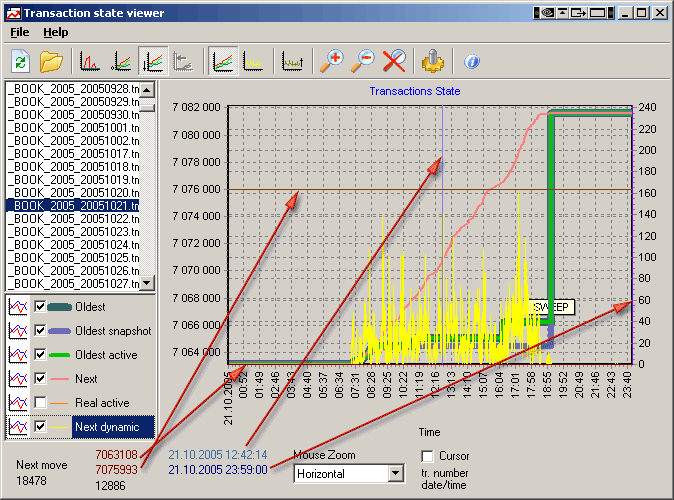
In the lower left corner you can turn different graph lines (Next, Oldest…) off and on . For example, if you wish to view transaction dynamics, turn on Next dynamic - it will show how many new transactions were started between IBTM readings from the database:

On the right, left, upper and bottom side of the graph there are special lines that you can drag (using the mouse) to check when an event has occurred and what value it has. Look at the vertical blue line at the middle of the graph, and at the brown horizontal line. When you move these lines, appropriate labels are changed – vertical lines let you point at specific time, horizontal lines let you point at specific transaction numbers:
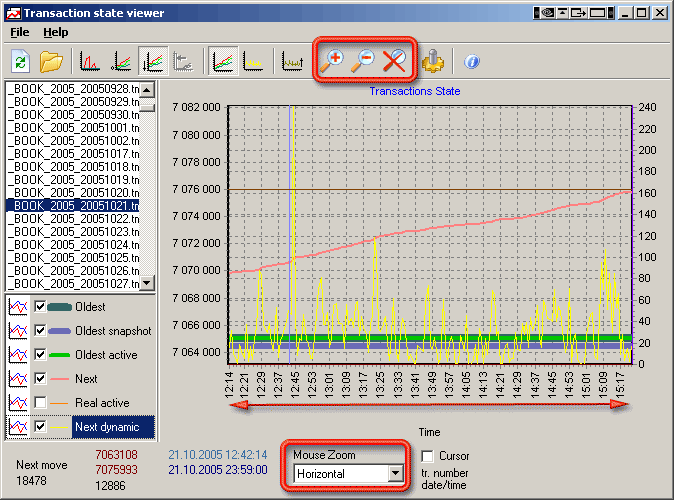
Also you may zoom in or out of the interval horizontally, vertically or in both directions. To return the graph to its initial state press the Reset Zoom button (or zoom using the mouse in the opposite direction).
Important! If IBTM statistics data was gathered using Firebird or InterBase 7.x access methods, you may view the real active transactions count.

This graph shows that on the 10th November 2005 there were from 65 to 105 active transactions, opened by applications. And, it can be seen that during lunch time (from 13:00 to 14:00) there were still about 80 active transactions. This means that:
- users don't close applications when they go to lunch
- applications have open and active transactions
Using this information you can make decisions about what might be wrong in the way the applications work. This will depend on how many transactions are directly managed by applications.
Graph view types
There are three buttons that change the graph view:
Relative (oldest). Computed by subtracting the Oldest transaction or Oldest snapshot (whichever is lower) from the Next and Oldest Active transaction numbers. Allows you to see the gap of semi-active transactions by looking at the legend on the left hand side of the graph. Here is an example of the previous graph with the Relative button turned on:

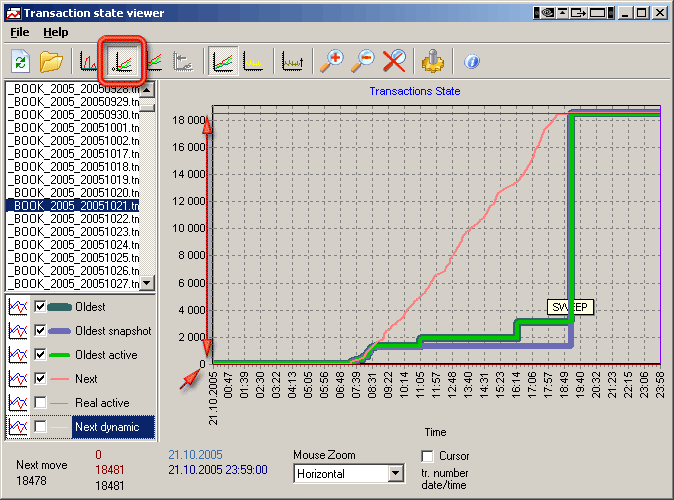
AutoMin. By default, when you open any IBTM statistics file, the lowest transaction number is automatically treated as "0". Normally, this would be the Oldest (interesting) transaction or the Oldest Snapshot.
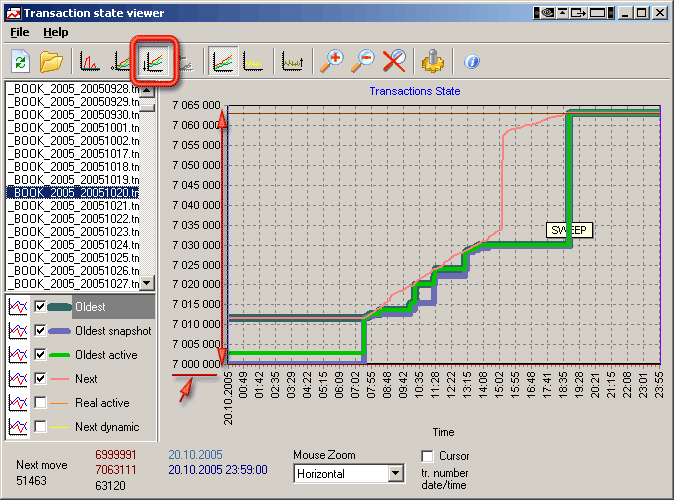
Abs. Allows you to see the transaction number flow and the difference for large transaction numbers. In the previous images the lowest transaction number was about 7 million, making it difficult to understand what the difference is , for example, between the Oldest and Next transactions. Here we can see that, for these statistics, the data difference was not more than 18000 transactions.
Technical support
If you'd like to have professional explanation of transactions behavior for your database, you'd probably order our technical support. Please read more about our services here.
Also please feel free to contact us with any questions by email [email protected].

 en
en